Two spectra from last night - one taken in the UV, the other in the visual spanning H beta to H alpha. Resolution of around 1000 - taken with UVEX using a 600 lines/mm grating through a Planewave CDK 12.5. Happily - all automated while I slept as it was only observable in the early hours of this morning.
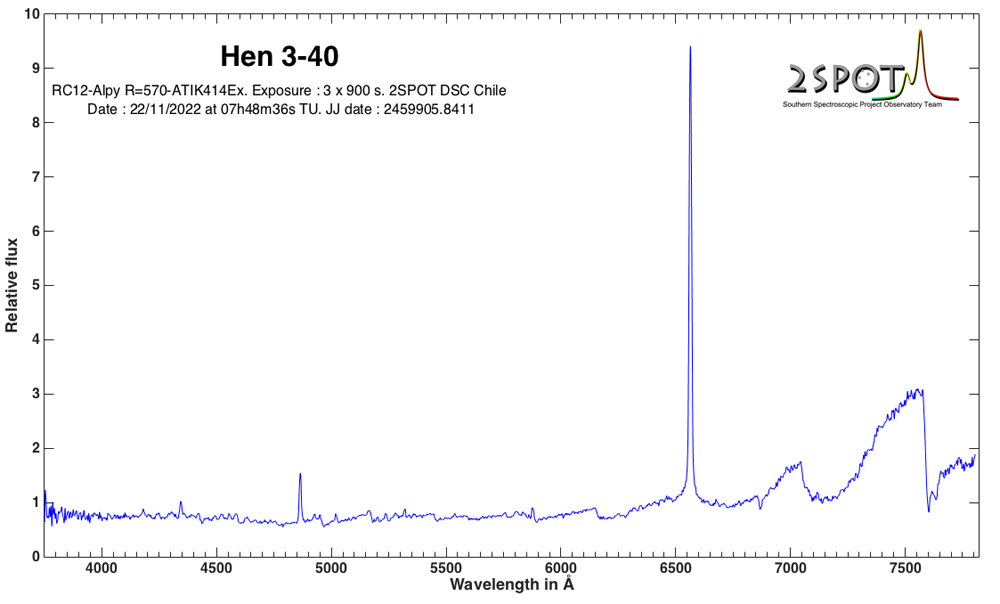
As Hamish's spectrum shows, there is a substantial Ha emission and another, though much smaller at H beta. It may simply be noise but to my eye there is a modest emission in some of the higher energy Balmer lines.
Looking more closely, there appear to be quite a few Fe II emissions as well. The 2 spectra overlap so I was able to confirm that these emissions are not just noise. I've attached an annotated plot of the visual spectrum with the y axis stretched to highlight the emissions. I couldn't find any He I emissions - the bump at 5018 is more likely Fe II than He I at 5015.68.
This target is described in Simbad as an emission-line star (which sounds like a fudge to me) and allocated spectra class B2. This is based on a survey undertaken in 2003. While the continuum may look like a B star, there shouldn't be Fe II emissions. I'll leave it to the experts to interpret this further.
I plan to work in the NIR and IR this evening - will report on anything I find.
This is in the visual range - roughly H beta to H alpha - taken with a UVEX 600 lines/mm grating on a CDK 12.5. I only managed 4 x 600s so its a bit noisy.
Simbad records a spectra type of O9.5-B0Ve and lists it as an X-ray binary. There are healthy He I absorption lines. Both Ha and Hb have a split profile - subplot attached. I'm intrigued by what appears to be an emission at 5878.7 A between the He I line at 5875.6 and the interstellar Na lines. It may just be noise. I plan to have another crack at this one in the next day or so and then move into the UV to see if there is anything interesting there.
Pete
Attachments
v520mon_20221210_514_Peter Velez_Balmer.png (21.97 KiB) Viewed 37568 times
Another spectrum of V520 Mon - this time in the UV.
Taken with UVEX 600 lines/mm grating on a PW CDK 12.5.
There is nothing particularly remarkable to see. Balmer and He I absorption lines. The H beta line is in emission and, like the spectrum from 10 December, the line is definitely split. I attach a plot of the UV spectrum and a subplot of the H beta line.
Pete
Attachments
v520mon_20221212_509_Peter Velez_Hbeta.png (19.23 KiB) Viewed 37511 times