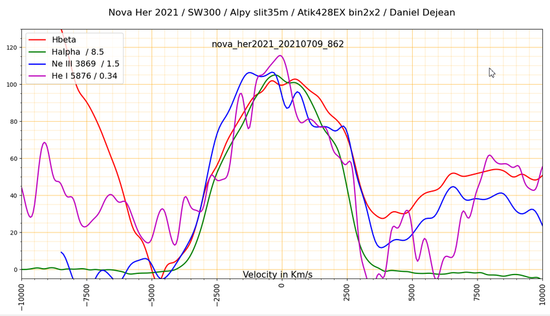
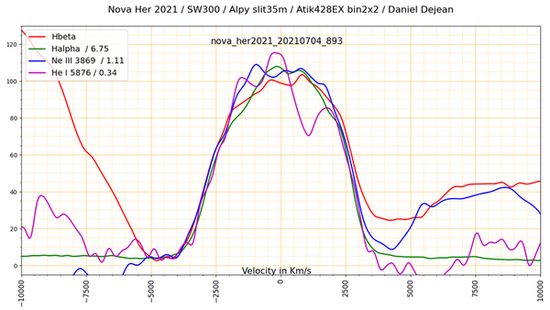
Poor weather condition since a few days…This is an opportunity to spend more time on my previous observations. To better understand the changes in lines intensity, I am using the excellent example from François Tessier and observers team for Nova Monocerotis 2012. If my understanding is right , the Hbeta emission is used as reference to compute the intensity ratio of others lines (Hbeta, He I 5876 and Ne III 3869 in my modest and limited trial). A quick and dirty evaluation is done using a graphical chart initially done to compare velocities. Each line intensity is adjusted to Hbeta level (defined as 100) . See following example for july04,2021, the adjustment factor for each line is shown in the legend box) :
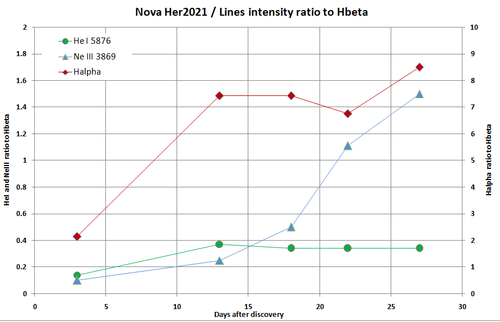
Same rough computation for my 3 others observations which allows to show a kind of trend for the past few days. Obviously there is not enough data here to come to a solid conclusion, however it looks like the Halpha and He I 5876 has started to decrease (versus Hbeta) 15days after discovery while Ne III 3869 shows a strong increase :
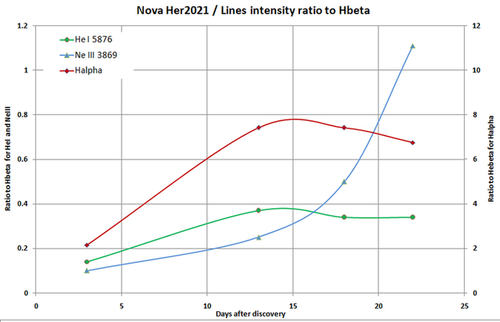
Not sure it make good sense...
Clear sky.
daniel