Including now Tim's spectra (0724.004, 0727.024), revealing the middle phase:
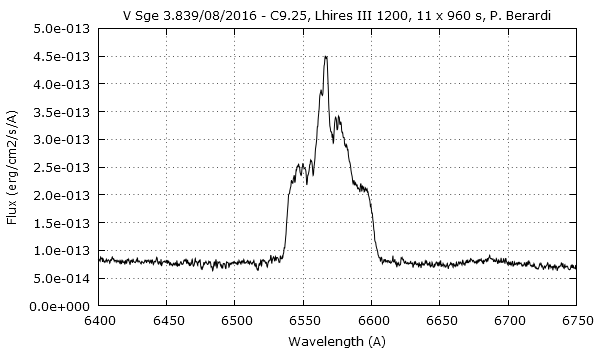
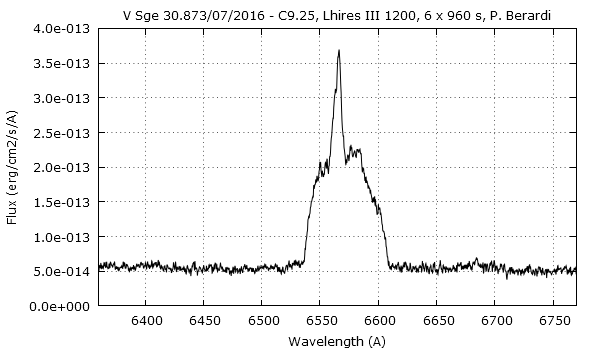
This time made a local continuum fit around H-alpha, too.
Did set the continuum to 0-level this time, considering the skew is misleading.
I can reproduce the above diagrams in postscript when necessary (fully batched via IRAF now).
As before, was using JD-MID (without any HJD conversion - could introduce just 8.3 minute skew).
I think the color composite of the above should also be interesting:

- vsge_all_composite_compr.png (11.89 KiB) Viewed 11039 times
Look at the differences of HeII 4686 and H-alpha on top and bottom (should be real, I think).
- Peter
Notes:
- fixed my own asdb_vsge_20160730_011.fit JD-MID locally, forgot to handle when applied per-exposure calibration manually (visible as JD-OBS being too close to JD-MID)
- colors yet need more manual effort, can't plot colors in .ps via IRAF somehow
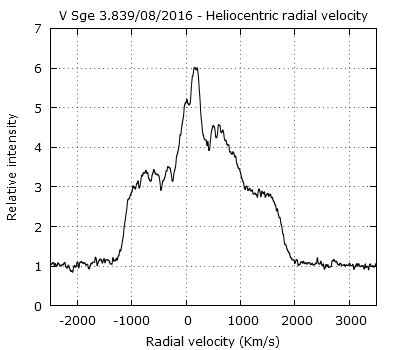
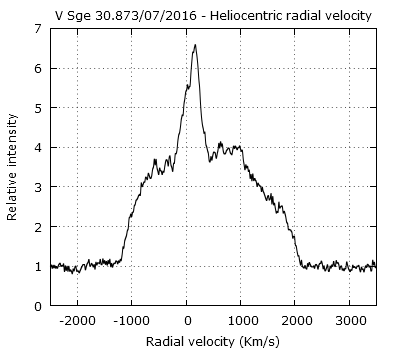
- used 4686, 4861.33, 6562.7 A for the zero references of velocity (couldn't find more accurate wavelength for He II 4686), maybe the He II could be tuned further
- I can publish IRAF the commands on another forum when someone is interested
EDIT: looking at differences on the color diagram H-alpha being too far from other features (also in time), but the eShel one matching all 3 features on 07.14 too well, puts up a suspect here some assumption being wrong. This needs more investigation.