Dear all,
First of all, I would like to congratulate you for your enthusiasm in this project and especially your very high reactivity in performing outstanding observations, using impressively high-resolution spectrographs.
All of this is really encouraging and should be further explored. You have a lot of questions and I will try to answer them, but likely not in one message.
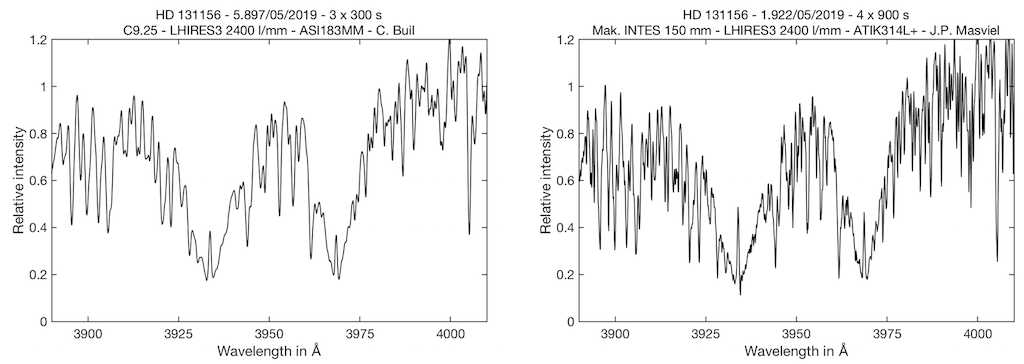
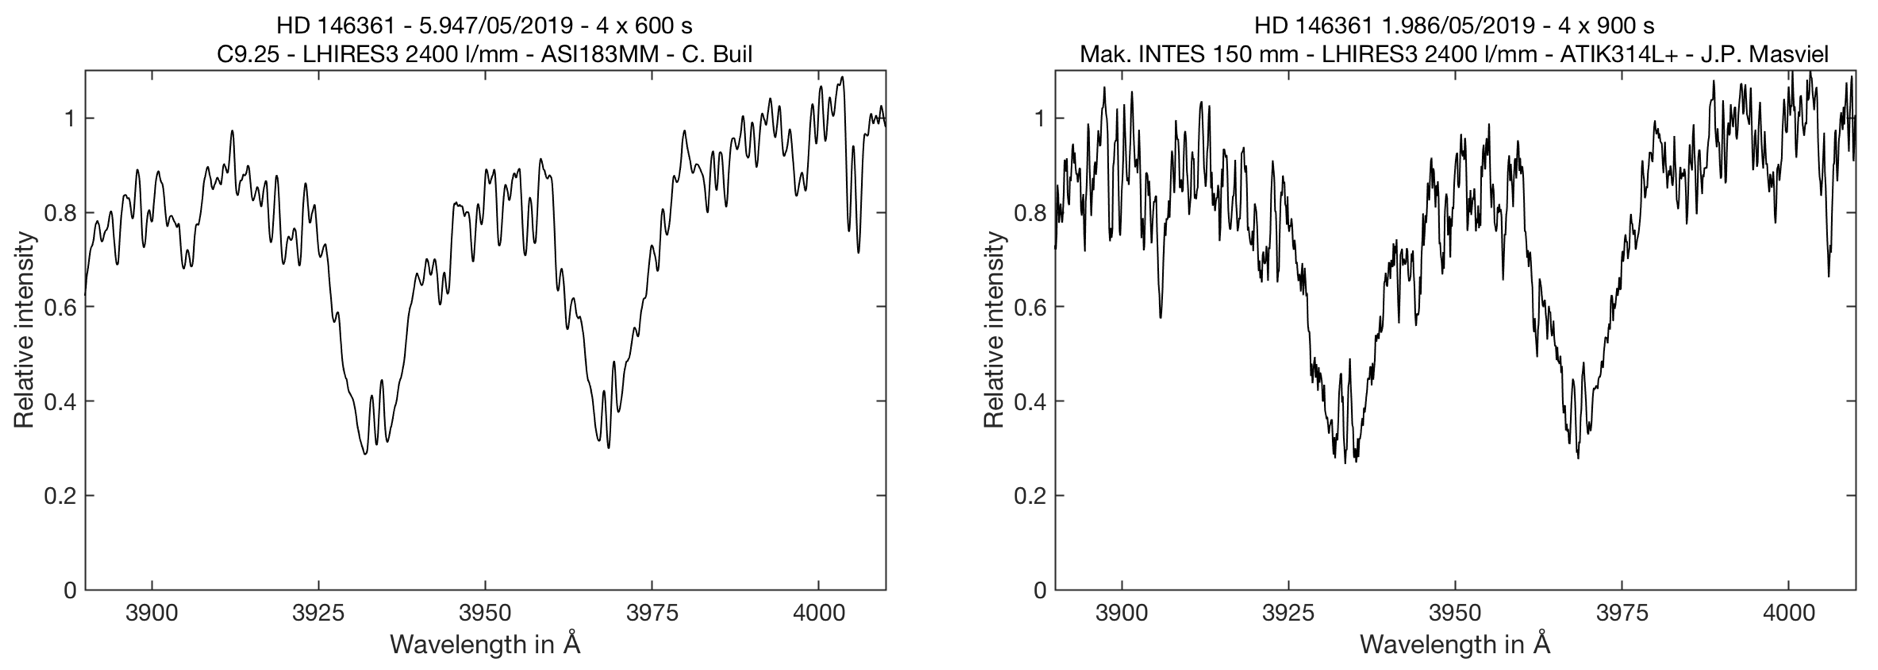
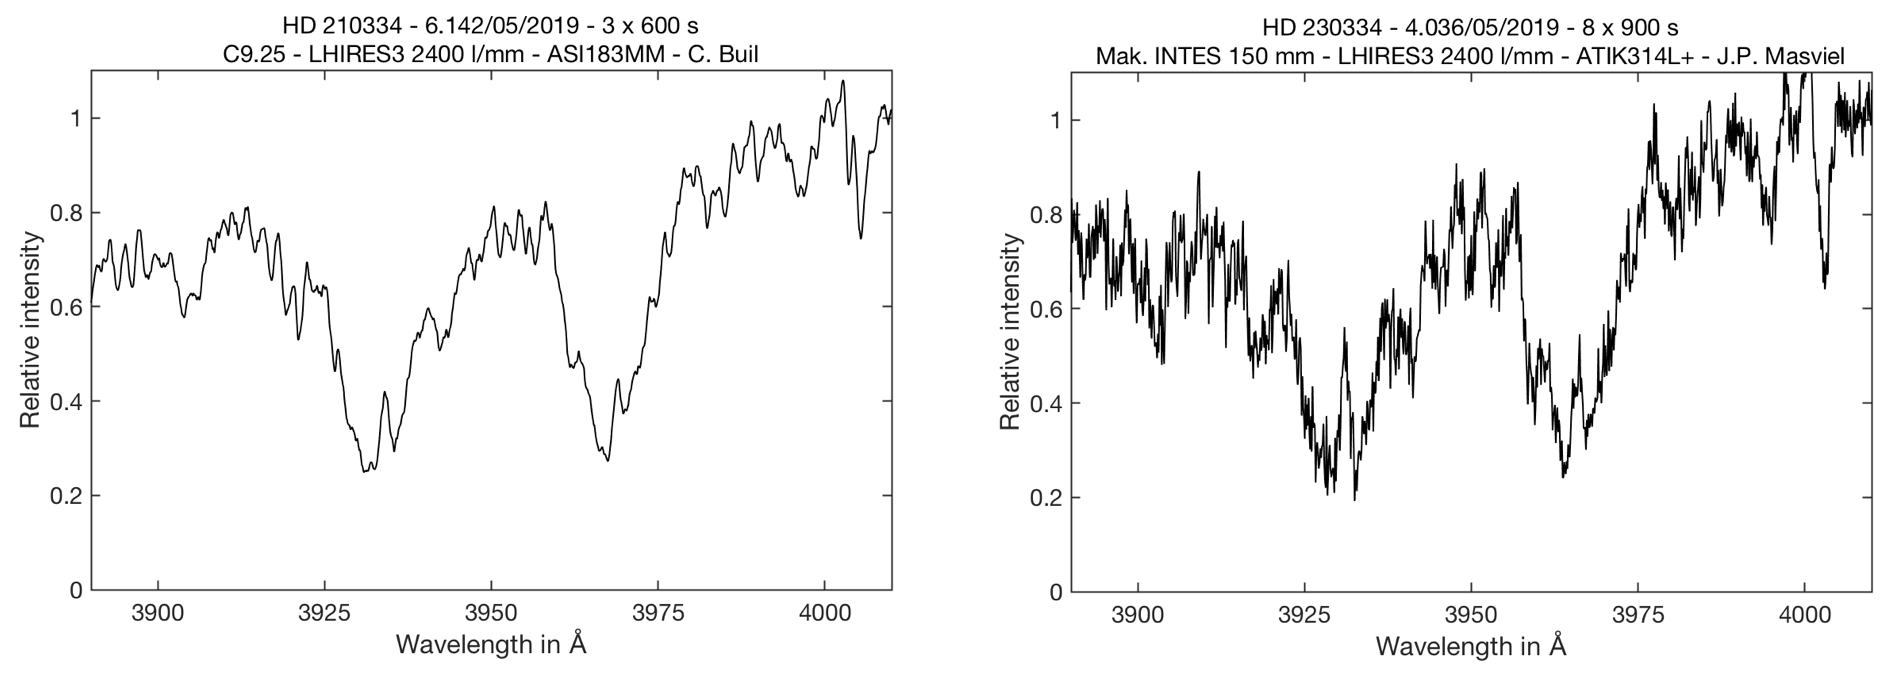
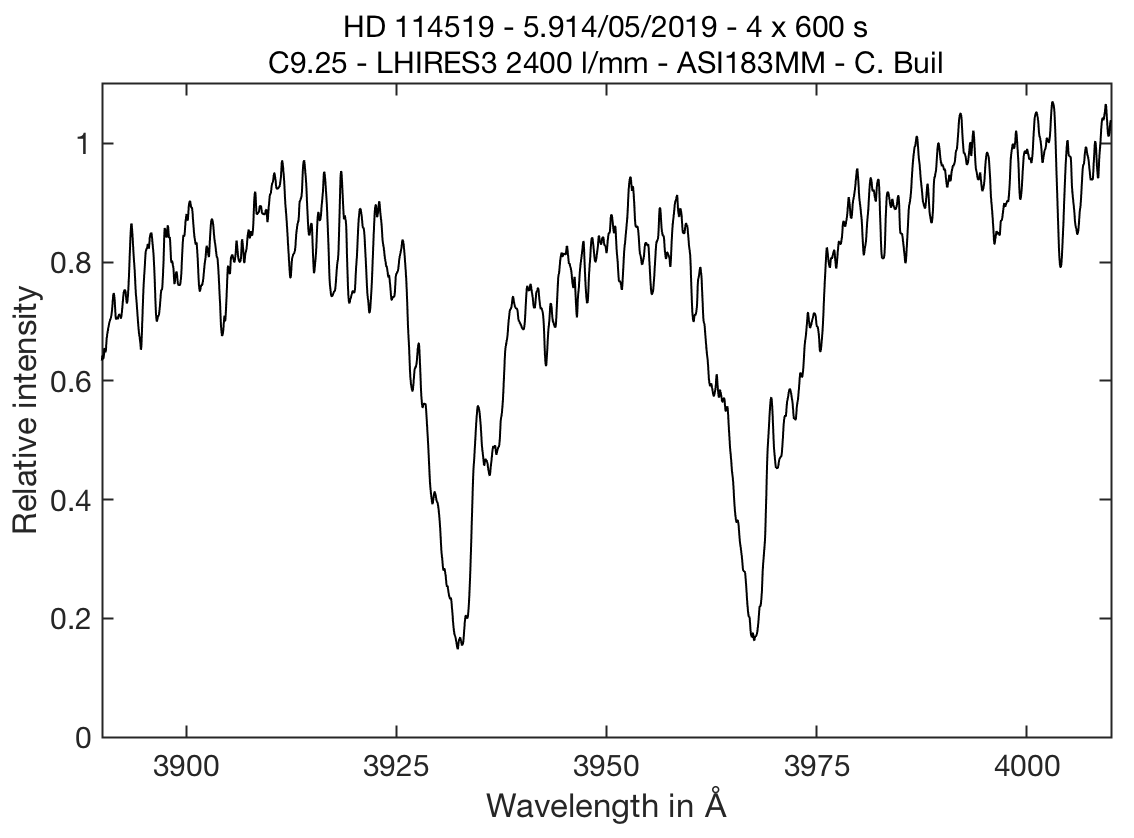
The emission peak in the core of the CaII H&K lines comes from the chromosphere of the star, that is heated by the magnetic field of the star. Therefore, this emission peak is one of the best proxy of the stellar activity. It was also observed for decades as part of the HK project at the Mount Wilson, which defined most of the metrics to use in this domain (such as the Sindex).
A few answers to your questions :
- The double-peak observed in the core of this CaII H&K lines is something normal in some stars. The Sun has such feature and is fully described in this quite-old publication
http://adsabs.harvard.edu/full/1970PASP...82..169L (don't worry if you don't understand everything, me neither)
- The Sindex is important to measure so that observations can be compared between observers and instruments, in particular with the historical Mount Wilson surveys.
- A database is indeed the next step. There is one planned, but you are going too fast for me

We can think on how to organise that.
So, getting such high quality spectra on the CaII H&K lines is a very good first step. The next step is to derive the Sindex for these stars are do time series over their rotation periods.
Here is an example of what we might expect for a moderately active star, in terms of Sindex variation. The plot below has 2 signatures, one periodic signal with a 18d period corresponding to the rotation of the star and a long-term trend indicating that the star undergo an evolution in his magnetic cycle.

Long term variability of the CaII H&K emission is used to study the magnetic cycle of the stars. Here is an example on how we used it:
https://arxiv.org/pdf/1107.5325.pdf
As described in the aforementioned paper, the Sindex is not the end of the story. The most used index is the logR'HK, which is based on the Sindex. The logR'HK is a kind of calibration to take into account the photospheric emission in order to compare the activity level of stars with different spectral type.
For instance, there was this study to link the chromospheric emission with the photometric variability:
https://arxiv.org/pdf/astro-ph/0703408.pdf (see fig. 7).
So, it would be great to develop a pipeline that can extract the Sindex values out of your spectra and then to work on calibrating these values to derive the logR'HK which is the main scientific information.
Note that starting in July 18 this year, the spacecraft TESS will be observing the northern sky for about 1 year. There will be (bright) stars to observe (with long time series) in the CaII H&K domain in order to further understand the connexion between the photospheric features (spots / plages) and the chromospheric emission.
cheers,
Alex
PS: I have issue in displaying pictures... Here is the link :
https://www.dropbox.com/s/lkwdg8h9uqykx ... n.jpg?dl=0