Compare on the plot August spectrum (eShel spectrograph) and
October spectrum (Lhires III spectrograph). Note the intensity increase of
red componant and some line shape deformations.
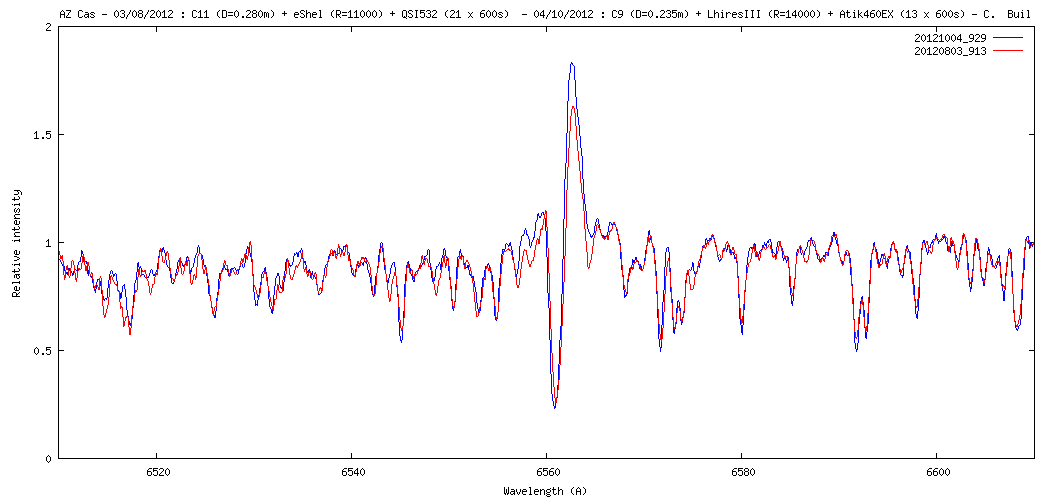
I have corrected for heliocentric radial velocity, but telluric lines are not
removed for the moment in the comparison plot (telluric lines are
shifted by about 0.26 A).
Note also equivalent performance for two very different configuration:
#1 Celestron 11 + eShel spectrograph at R=11000 + QSI532 CCD camera and 21 x 600 s exposure
#2 Celestron 9 + Lhires III spectrograph ar R =14000 (35 microns slit) + Atik460EX CCD camera and 13 x 600 s exposure
Observation continue !
Christian B