I transfert here a message from James Foster about EW measurement:
by James Foster » Sat Feb 08, 2020 2:06 am
To: Benjamin,
Yes I should have used the spc_ew for absorption lines....I did this, but disregarded the results. Here is what I have for my three (3) Alpha Orion spectra taken with the LhiresIII with 2400 l/mm grating:
09Jan19:
SpcAudance Terminal Comm used:"spc_ew _aoriha_20190109_340.fit 6535 6595 6 n 2"
# Date: 2019-01-09T08:10:09
# JD: 2458492.8404
# EW(60.00=6535.00-6595.00)=1.956 A.
# Sigma(EW)=2.431 A.
# SNR=17.
# 1.956 2.431 17 2458492.8404 {EW(60.00=6535.00-6595.00)=1.956 A.}
11Dec19:
SpcAudance Terminal Comm used:"spc_ew _aoriha_20191211_381.fit 6535 6595 6 n 2"
# Date: 2019-12-11T09:08:51
# JD: 2458828.8811
# EW(60.00=6535.00-6595.00)=0.799 A.
# Sigma(EW)=1.810 A.
# SNR=23.
# 0.799 1.810 23 2458828.8811 {EW(60.00=6535.00-6595.00)=0.799 A.}
13Jan20:
SpcAudance Terminal Comm used:"spc_ew _aoriha_20200113_272.fit 6535 6595 6 n 2"
# Date: 2020-01-13T06:31:38
# JD: 2458861.7720
# EW(60.00=6535.00-6595.00)=0.805 A.
# Sigma(EW)=1.576 A.
# SNR=27.
# 0.805 1.576 27 2458861.7720 {EW(60.00=6535.00-6595.00)=0.805 A.}
Here is a SpcAudance plot of the last spectra showing the "EW Splice:"
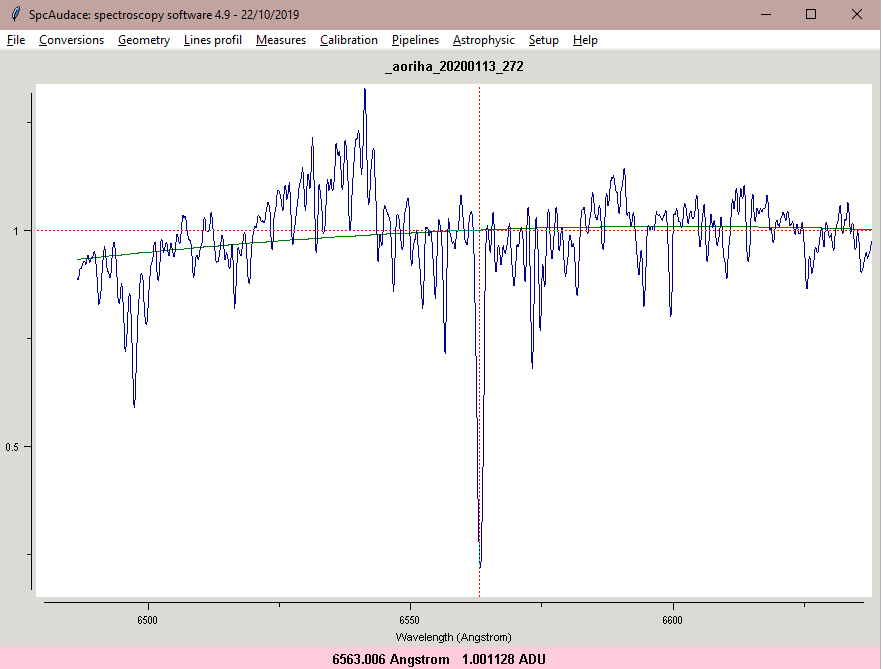
Not sure why I'm getting the positive EW values of 1.956A, 0.799A, & 0.805A for the Ha spectra for 09Jan19, 12Dec19, & 13Jan20 respectively.
It still looks like Betelgeuse EW at Ha has decreased significantly since last year.
James
About EW measurement (message from James Foster)
-
- Posts: 258
- Joined: Thu Sep 29, 2011 10:14 am
About EW measurement (message from James Foster)
Spcaudace spectroscopy software: saving you hundred hours of frustration.
-
- Posts: 258
- Joined: Thu Sep 29, 2011 10:14 am
Re: About EW measurement (message from James Foster)
Hi James,
- When you are trying to find the best continuum, you need to overplot it in order to see it by changing "n" to "o" in the command.
- About computation wavelength limits:
Here you choose 6535.00-6595.00 interval while Ha line is very narrow. Consequently your EW values will be contaminated by too much noise and shapes that haven't matter with Ha line. This may be something like 6560-6564...
Just simply use continuum wavelength that a close to Ha line absorption: here this will be the two emission that frame the asborption.
Hence your measurement will only consider Ha line.
In you plot, this approximatly where green continnuum croses star's line profile.
- Continuum fiting way : I would have choosen a polynomial order equal to 1. But order "2" seems ok too.
Benji
Spcaudace spectroscopy software: saving you hundred hours of frustration.
-
- Posts: 1933
- Joined: Mon Sep 26, 2011 4:41 pm
- Contact:
Re: About EW measurement (message from James Foster)
Hi Benji, James
You are wasting your time trying to measure the EW of H alpha in these spectra There are two problems here
1. The green line is nowhere near the continuum. It must follow the peaks between the absorption lines, not some rough average through them. Unfortunately because the lines are unresolved it is impossible to determine the true continuum.
2. The H alpha line is not isolated. It is blended with many unresolved absorption lines so at best you are measuring the EW of H alpha plus several other blended lines
This means it is impossible to get a reliable consistent measurement of H alpha EW. The method you should use is to divide each spectrum by a template reference spectrum. That way you can see and measure any changes directly
Cheers
Robin
LHIRES III #29 ATIK314 ALPY 600/200 ATIK428 Star Analyser 100/200 C11 EQ6
http://www.threehillsobservatory.co.uk
-
- Posts: 1933
- Joined: Mon Sep 26, 2011 4:41 pm
- Contact:
Re: About EW measurement (message from James Foster)
For example if 20191211 is used as the template. Dividing 20200113 by the template gives the change with the constant lines and the continuum divided out. The reduction in H alpha absorption is then obvious and the EW change can be measured with good accuracy as 0.46A
Cheers
Robin
Cheers
Robin
LHIRES III #29 ATIK314 ALPY 600/200 ATIK428 Star Analyser 100/200 C11 EQ6
http://www.threehillsobservatory.co.uk
-
- Posts: 321
- Joined: Fri Sep 30, 2011 12:23 pm
Re: About EW measurement (message from James Foster)
Robin is there still an issue with how you normalise the spectra especially if the continuum is changing?
Not that there is an ideal answer
Regards Andrew
Not that there is an ideal answer
Regards Andrew
-
- Posts: 439
- Joined: Sun Jan 24, 2016 7:14 am
Re: About EW measurement (message from James Foster)
To: Robin,
RE:"You are wasting your time trying to measure the EW of H alpha in these spectra There are two problems here......"
I will follow your procedure, but first I need to re-process the a Ori spectra with a common IR source and normalize them in x-axis.
Have 2 more LhiresIII a Ori (9&11Feb20) to process.........
James
James Foster
eShel2-Zwo ASI6200MM Pro
Lhires III (2400/1800/600 ln/mm Grat) Spectroscope
LISA IR/Visual Spectroscope (IR Configured)
Alpy 200/600 with Guide/Calibration modules and Photometric slit
Star Analyzer 200
eShel2-Zwo ASI6200MM Pro
Lhires III (2400/1800/600 ln/mm Grat) Spectroscope
LISA IR/Visual Spectroscope (IR Configured)
Alpy 200/600 with Guide/Calibration modules and Photometric slit
Star Analyzer 200
-
- Posts: 1933
- Joined: Mon Sep 26, 2011 4:41 pm
- Contact:
Re: About EW measurement (message from James Foster)
Hi Andrew,Andrew Smith wrote:Robin is there still an issue with how you normalise the spectra especially if the continuum is changing?
Not that there is an ideal answer
Regards Andrew
Probably but comparing with a template allows you to see the wood for the trees.
In this case the ratio was not quite flat ie there was some broad change in continuum shape so I did normalise the ratio using a low order spline fit to be able to make the "EW change" measurement but it was much easier to do compared with trying to guess the continuum in the original spectra.
I think it is important in cases like this to consider first what you are trying to measure and use the appropriate tools. Measuring EW directly in spectra like this where all lines are blends and there is no continuum is effectively impossible. Here dividing out the stuff that is not changing (or perhaps subtracting rather than dividing, or even converting the spectra to absolute flux using brightness measurements and then taking the difference might be better) allows you to see what is changing and make some sort of quantitative measure of it.
There is other interesting information revealed the ratio of these spectra too. For example the broad change in the local continuum shape results from the deepening of the molecular bands which is seen in low resolution spectra. The same technique using the Jan 2019 and Dec 2019 spectra is also interesting. There appears to have been little overall change in H alpha intensity but the shape of the line is different producing a W shape line profile in the ratio.
Cheers
Robin
LHIRES III #29 ATIK314 ALPY 600/200 ATIK428 Star Analyser 100/200 C11 EQ6
http://www.threehillsobservatory.co.uk
-
- Posts: 321
- Joined: Fri Sep 30, 2011 12:23 pm
Re: About EW measurement (message from James Foster)
Good points Robin, I have been looking at subtracting the pre flare spectra from the flare spectra I go of HIP25953 as both the continuum and lines are changing significantly. The attached is the result at the peak.
Regards Andrew
Regards Andrew
-
- Posts: 258
- Joined: Thu Sep 29, 2011 10:14 am
Re: About EW measurement (message from James Foster)
Hi all,
I agree with Robin: EW measurement isn't the best way to study such star with such resolution.
Although my answer was only focused on helping James, about how to do EW measurements with SpcAudace.
As discussion is envolving on an other subject, it's time to go back in the dedicated section of the forum.
Cheers,
Benji
Spcaudace spectroscopy software: saving you hundred hours of frustration.