see https://www.youtube.com/watch?v=U1fvMSs9cps
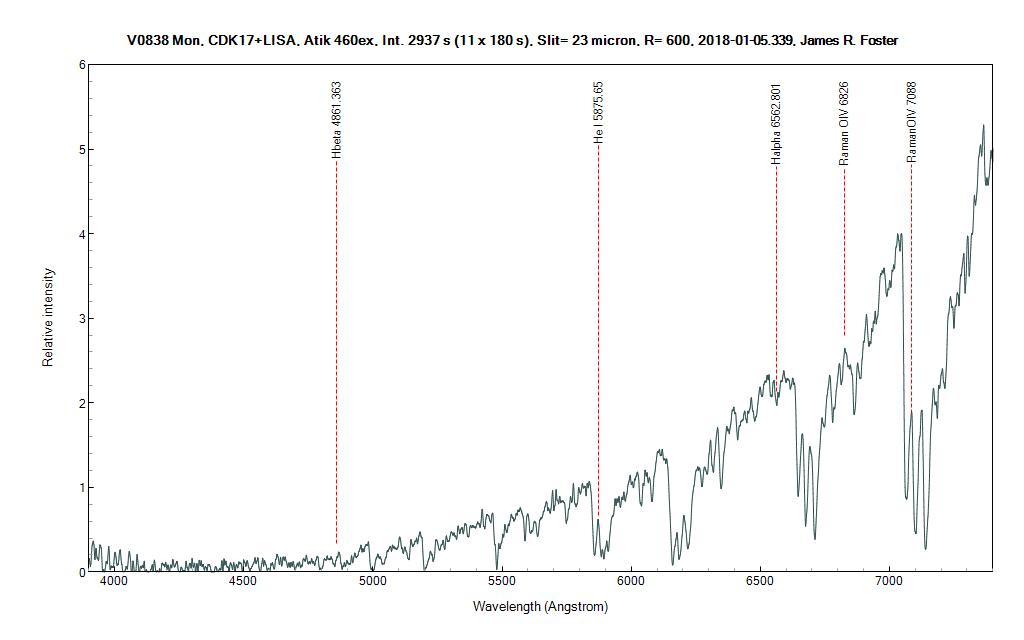
This spectrum came from 10x300sec exposures 2x2 binned with the LISA spectroscope on the CDK17 with a 19 micron slit and imaged with the Atik 460ex CCD; R= 951
I could only identify a few lines and the HeI is highly suspect; almost no hint of the balmer series except the nearby (to H-epsilon) Ca+ K line in the near UV; see:
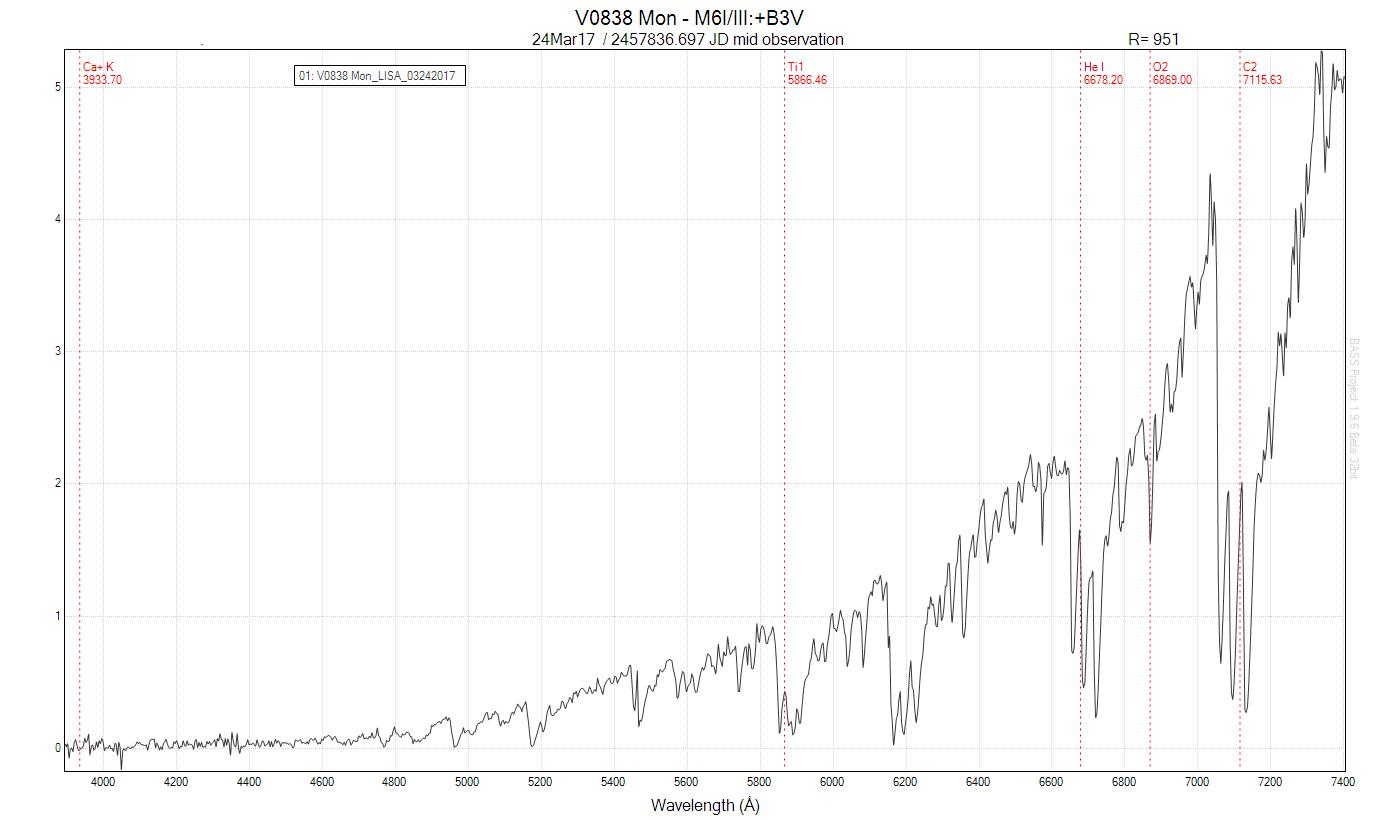
I used the A4V star, SAO133870, to calculate an instrument response for reducing the V0838 Mon data. I also clipped some of the data long-ward of 7400A since this was
causing my short wavelength data to be very small on the y-axis.
James