Low res observation is showing that another Hα brightening cycle is underway. The last observation on the graph is from Thursday night 7th December....
VV Cep Hα and Hβ EW evolution Jul '16 - Dec '17.png (38.48 KiB) Viewed 18446 times
New Year's Day evening provided a windy opportunity to capture the first VV Cep spectrum of 2018. The fading of the Hα has picked up pace again after the most recent brightening cycle....
VV Cep eclipse progress up to 1st Jan 2018.png (27.83 KiB) Viewed 18355 times
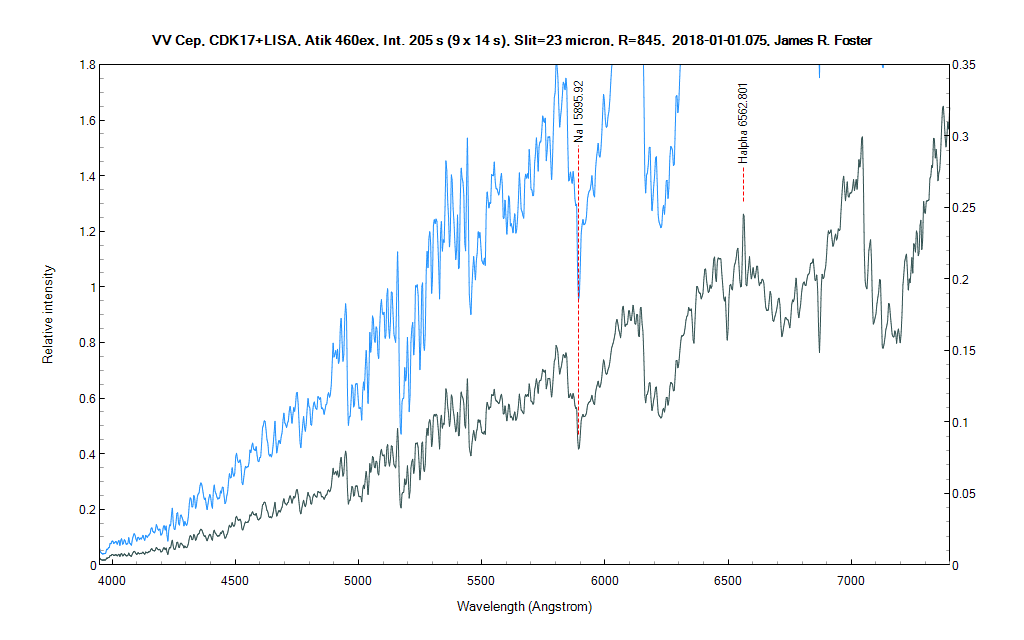
Here is a VV Cep low resolution (LISA) spectrum I took 2 night ago:
Not much to comment on....looks like a typical red giant spectrum....little blue companion totally eclipsed?
James
James Foster
eShel2-Zwo ASI2600MM Pro
Lhires III (2400/1800/600 ln/mm Grat) Spectroscope
LISA IR/Visual Spectroscope (IR Configured)
Alpy 200/600 with Guide/Calibration modules and Photometric slit
Star Analyzer 200
Hi James,
That is a very nice LISA spectrum. Would you be happy to send me the FITS file so that I can measure the Equivalent Width (EW) of the Hα emission and compare it to my own ALPY measurement on the same night? In principle the EW should independent of the resolution.
Based on spectra and comments posted under some of the other VV Cep 'topics' on here there seems to be a concensus that the little blue companion went into eclipse a couple of months ago. The much larger Hα emission region around the star still seems to be shrinking in our line of sight. It'll be interesting to watch over the next days whether the emission eventually plateaus or is completely eclipsed. Clear skies are in short supply though here in southwest England!
Cheers
Hugh
Hope your English weather improves! Let me know if you don't get an email with a link to the .fit file of VV Cep.
I think our weather is turning "English" with rain foretasted the next 2-4 days.
James
James Foster
eShel2-Zwo ASI2600MM Pro
Lhires III (2400/1800/600 ln/mm Grat) Spectroscope
LISA IR/Visual Spectroscope (IR Configured)
Alpy 200/600 with Guide/Calibration modules and Photometric slit
Star Analyzer 200
Has the Hα eclipse reached second contact at last? My latest observation tonight 7th Jan suggests that the fading of the Hα emission may have reached a plateau.A cycle of brightening now would not be expected based on the approximate period that can be discerned in the earlier data. Another measurement in a few days time would be ideal....
VVCep eclipse progress to 7th Jan 2018.png (28.5 KiB) Viewed 18285 times
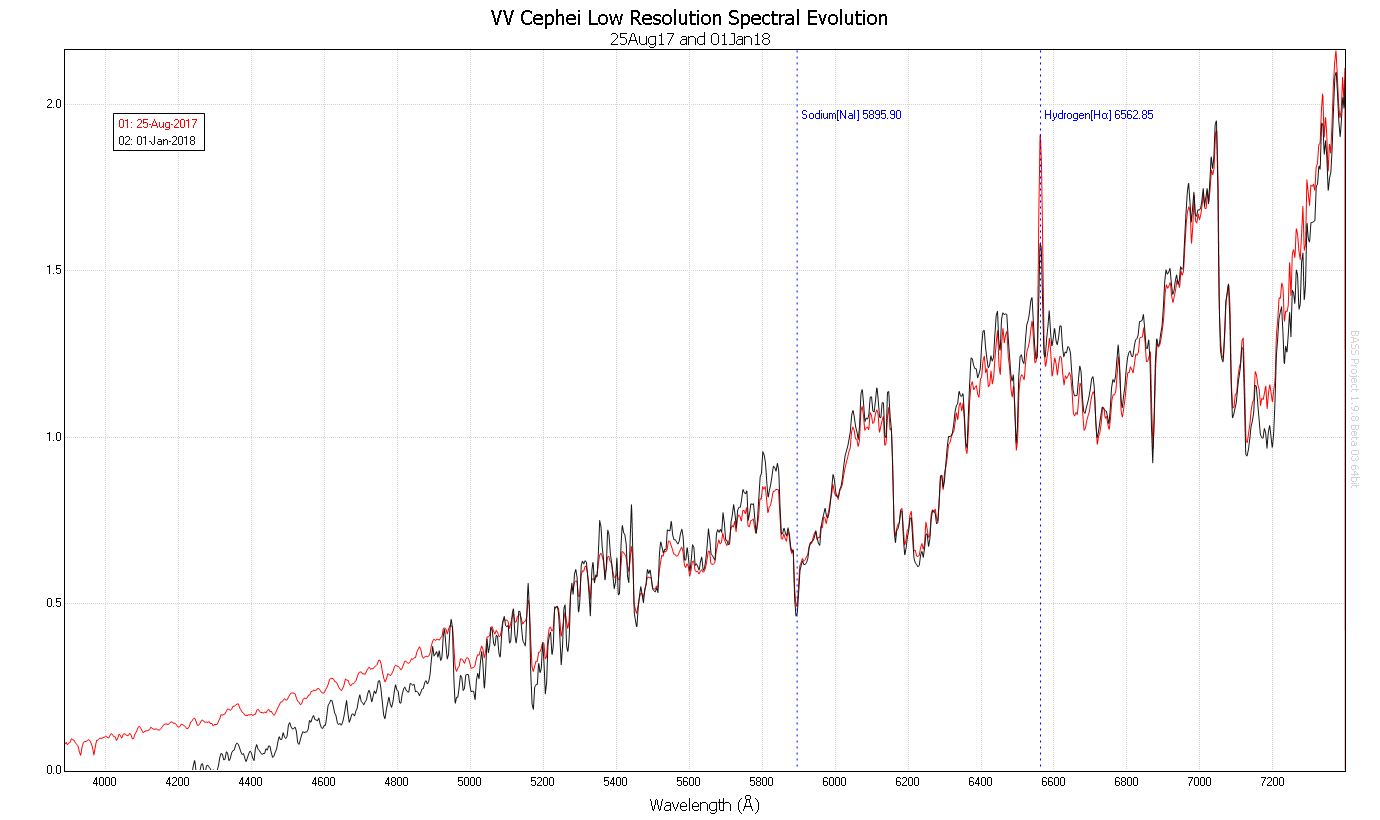
I made a chart showing the difference btw my Aug17 & Jan18 LISA spectra of VV Cep:
I used the Na absorption feature to scale the y-axis of both graphs to roughly coincide. The Ha emission definitely shows a loss btw the dates....guess
the blue companion is no longer contributing to this line and the shorter wavelength bands.
James
James Foster
eShel2-Zwo ASI2600MM Pro
Lhires III (2400/1800/600 ln/mm Grat) Spectroscope
LISA IR/Visual Spectroscope (IR Configured)
Alpy 200/600 with Guide/Calibration modules and Photometric slit
Star Analyzer 200
Latest update to my chart of Hα and Hβ Equivalent Widths. Thanks Jim Ferreira and James Foster for providing their spectra so that we have much better sampling of the two curves. The Hα curve had been showing a general decline overlaid by periodic re-brightening in line with Ernst Pollmann's high resolution results. The latest results are deviating from that pattern. Perhaps a sign that deepest eclipse of the Hα region has now been reached?
Cheers
Hugh
Hi Hugh,
in order to compare your graph with the total ARAS EW monitoring, I have drawn it for the same time section as yours. As you can see, there is an certain agreement of the variabilty in your diagram to ours.
The deviation of yours to the ARAS monitoring is caused maybe by the clear lower spectral resolution of your used spectrographs. The integration interval of EW determination of the ARAS monitoring is between 6551 to 6573 Angstr. The accuracy of the EW measurements is (+/-) 5%. Could you say something about the interval and the accuracy in your diagram?
Ernst Pollmann