http://www.astronomie-amateur.fr/Symbio ... iques.html
Its first outburst was detected in 1866 during which Huggins obtained the first spectrum of a nova. The second outburst occurred in 1946, making T CrB a recurring nova.
- Vis_1946.png (30.14 KiB) Viewed 8900 times
In 1956, the symbiotic star (SySt) nature of T CrB: binary system composed of a red giant (RG), and a compact object, most often a white dwarf (WD) accreting hydrogen-rich gas emitted by the stellar wind of the RG, by capture of thewind that is concentrated toward the orbital plane the subsequent formation of an accretion disk. The accreted gas acumulates on the WD surface, likely mixing inward and eventually reaching a pressure and temperature at which nuclear reactions start. This is the same as a symbiotic star, but in these systems the WD is more massive and the ignition -- under degenerate gas conditions -- leads to a runaway thermonuclear process that ultimately results in the ejection of part or all of the accreted gas. This last step, after a long qiescent period of only mild burning and hot emission fromthe inner disk and accretion region, has the same dynamical properties as a classical nova. The fundamental difference is in the manifestation of the ejecta expansion. It occurs within the wind of the companion, not in the free space surrounding a classical nova or compact recurrent system.
Recurrent novae, whose mean recurrence time is known, offer a unique opportunity to observe the spectral development of a nova, before, during and after the event
Thanks to our quick response, we have already contributed significantly to the documentation of the nova phenomenon, notably through the production of spectra during the often very fast rising phase. Thanks to our high cadence observations for novae and outbursts of symbiotic stars, we have contributed significantly to the knowledge of these phenomena (see for example our significant and highly appreciated contribution during the outburst of RS Oph last year. See EAS 2022 Valencia Meeting). The value of these contributions is far more significant than the acquisition of *one* spectrum of identification that is useful but only adds a new element to the collection.
We propose a new challenge, that of documenting the very first moments of a nova event. The interest can be considerable, especially to validate theoretical models or to open new bases for this modelling. It is also essential in light of the increasing number of transient surveys that will need optical follow-up for identification and evolution studies. It is this second role that is especially important, one that can be accomplished with great efficiency by an organized community than is otherwise possible from single large telescope facilities.
Only amateurs with their collective “striking power” can set such a goal and achieve it. This feat is beyond the reach of professional teams who cannot permanently mobilize a telescope. We can because there are dozens of us who can participate in a collective project. And even if only one of us achieves the feat, its result will also be the product of our collective commitment.
While recurrent, these novae are not precisely periodic and the 80 years between the two historical outburst of T CrB -- resulting in a predicted outburst in 2026 -- is still only an extrapolation. The comparison of the preoutburst light curves in the 1940's’ and the last ten years led Brad Scheafer to propose that the outburst will be on 2023,6 +/- 1 yr.
Using a comparison between historical light curve and the current one, it appears that a preoutburst phase can be detected from a rise of the luminosity, especially in B bands (see http://www.astrosurf.com/aras/novae/Inf ... 019-04.pdf)
- TCrB_B_1946_Now.PNG (28.4 KiB) Viewed 8900 times
This high state (characterized by some authors as super-active state, but subject to debate) being monitored by several teams, including ARAS observers and is documented in several publications. This preoutburst high state is attributed to an increase of the accretion rate toward the disk and the boundary layer. Observing the lower luminosity of the current lightcurve in comparison to 1936-1946, Luna+ (2020) estimates that the outburst could be delayed to 2023-2026. But the lower luminosity could be also attributed to absorption effects in the upper layers of the accretion disk and, possibly, from circum-WD wind environment.
As the next outburst of T CrB offers so important an opportunity, we should assume that the outburst can happen at any moment from now. Possibly during the next months, probably in the next years, very probably in the next decade.
Another clue can help us: the two previous outbursts have taken place near the inferior conjunction of the RG that will next occur on 08-12-2022.
A third clue, from B. Sheaffer, is that during the high luminosity state sudden short declines appear in B and V. They can help for our monitoring.
- TCrB_forecast.png (3.32 KiB) Viewed 8899 times
Blue dots: inferior conjunction of the RG
Triangle: Today
Cadency:
In order to achieve the goal, the cadency should be 1 spectrum per day or quicker during outburst.
The nova outburst develops such that a “null” observation in Europe can be followed 8 hours latter by a detection in North America.
At the date, we propose at least 1 spectrum per 2 days and maximal delay of 7 days. As soon as possible the rate should be one spectrum/day, depending on the number of participants and/or especially if we detect any significant change in the light curve or morphology of the spectra.
I urge you to redouble your efforts on T CrB. YIt would be extremely interesting and valuable to push as far into the ultraviolet as possible, as there are some interesting lines well below 4000 Å. I can hope that you push into the near-Sun interval, so that the line radial velocities can be measured from many phases around its orbit; for a mid-latitude northern observatory, T CrB can be recorded even through its solar conjunction, yielding full year-round measures.
Bradley E. Schaefer, Louisiana State Univ. (Baton Rouge, Louisiana, United States)
Equipment:
Most of experiment amateur setups are able to produce spectra with a good SNR from low to high resolution (in amateur signification) at the current luminosity of the target (V = 10, B = 10.7). See e.g. the last spectra secured by Joan Guarro (R = 9000) and Umberto Sollecchia (R = 12000) with a good SNR.For new observers, the goal will be to improve their techniques.
Methods:
One key point, especially for low resolution spectra is to obtain an accurate and reproductible SED. Absolute spectrophotometry is extremely important.
In order to facilitate the comparisons, we shall suggest reference star(s). This subject is under discussion
The following stars are used currently by the observers:
HD 143894 A3V
HD 143807 = iot CrB (in Miles data base, but spectroscopic variable in Simbad)
HD 140664 A2V
Any commented input for the choice of a reference star will be appreciated
Notes:
The difference of altitude between the target and the reference star should be minimized (adapting the acquisition protocol for that purpose)
One can use: http://www.astronomie-amateur.fr/Docume ... er_V3.xlsm
Low resolution:
(Recall : due to slit effects, the duration should be at least 30 s)
alpha CrB could be used for high resolution spectroscopy which requires longer exposures
Note: a by-product of such a campaign is that new observers (and more experienced) can compare their spectra, improve their acquisition methods, reduction of the data…
Resolution and ranges of interest:
Low resolution
Between nova event, the spectra of T CrB show essentially lines of HI, He I and He II, well separated. Thus, any spectrum at a resolution > 500 (eg Alpy) produces valuable information notably HeII/H beta ratio. Note: Ilkiewicz+ (2016) used Alpy and LISA spectra for a publication about the high state of the target.
R = 1000 class of spectroscopes (eg LISA, UVEX visible) have a sufficient resolution for a good evaluation of He I 5876. The He I sequence is very important and if possible nebular transitions (e.g., [O III], [Ne III], [N II], [O I]) should also be observed. Whenever possible, for the grating (non-echelle) high resolution spectra, try using a set of positions through which you cycle.
Near UV
The intensity of the continuum between 3500 and 4200 and the Balmer jump produce very valuable information about the activity of the hot component (Accretion disk in the current phase). UVEX in near UV mode is a must.
Near IR: no significative information during the present state.
High resolution and low range:
The classical H alpha is monitored by Umberto and is useful. Lhires III equipped with a 1200 or 2400 l/mm can be used for that.
If possible, He II + H beta range at high resolution, with both lines is very interesting.
Echelle spectra
No comment
Photometry:
Do not hesitate to produce photometry (B and V bands especially)
This photometry can also be used for flux calibration of the spectra.
Important note: as usual for Eruptive stars database, only use your own photometry. This is especially important for T CrB as the target is subject to flickering at various time scales.
Due to the flickering, the calibration is not easy. A method will be proposed soon.
Send Spectra to francoismathieu.teyssier (gmail.com) for inclusion in the database and copy to arasdatabase (gmail.com) for double check by David Boyd and Woody Sims.
https://aras-database.github.io/database/tcrb.html
(630 spectra from 2012 to now)
Tools:
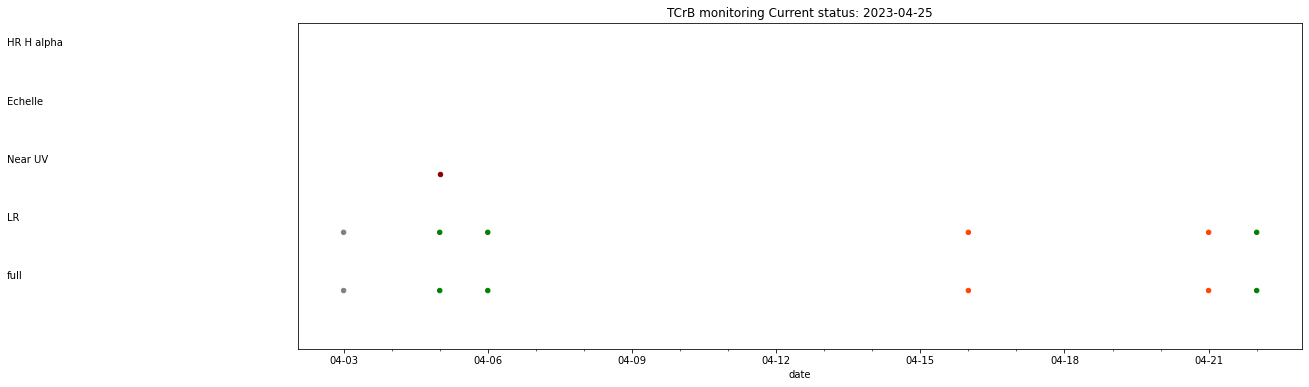
The spectra will be uploaded daily in the database (and immediately during the outburst) A summary of the monitoring is updated daily in the form of a graph:
https://aras-database.github.io/databas ... s/tcrb.png
A shared agenda to exchange on the forecasts of observations is in preparation
An automated message will be send to the observers when a gap of more than 4 days will be observed
This topic in the forum is a good place to share the results, discuss the progress of the monitoring, alert on peculiar evolution (both in spectro and photometry) A monthly report (including log) will be published as a supplement to the Information Letter
A key question: is such an investment in observation time profitable?
The answer is yes! The very first phase of the rising is fundamental AND all the spectra acquired at a very cadency will be a great dataset for the studying of the preoutburst phase (see the papers already publish about the current high state) and a legacy for the future for all such systems.
23/07/2022
This text is the result of a collective discussion including François Teyssier, Vincent Lecocq, Matthieu Le Lain, Christophe Boussin, Ibrahima D., ...
It was reviewed and amended by Steve Shore
Current status:
- EW_Hb.PNG (49.31 KiB) Viewed 8896 times
- EW_HeII.PNG (55.98 KiB) Viewed 8896 times